US Dollar Rebound Increases Near-Term Risk

Last week we noted that the odds favored more upside in precious metals before a larger correction would begin. While that view remains on track, we want to note the renewed strength in the US Dollar which could provide immediate resistance to higher levels in Gold and gold stocks.

The chart below plots the weekly candles for the US$ index and the net speculative position in the US$ index. The US$ index closed back above its 200-day moving average (97) and remains well above its 400-day (or 80-week moving average). The larger consolidation appears to be an ascending triangle which is a bullish continuation pattern. Upon breakout through 100, the pattern projects an upside target of 107. Moreover, although the US$ index is only a few points from major breakout territory its net speculative position (as of Tuesday) is the lowest in 18 months!

Feb262016USD

US$ Index & CoT


The improving prognosis for the US$ index could be due to renewed weakness in the Yen. The chart below plots the Yen/US$ pair and Gold. Many other analysts long before me have noted the strong correlation between the two markets. The Yen/US$ pair may have formed a double top at 0.90. If that is the case then it has more downside potential in the short-term. Meanwhile, the question for Gold, which closed the week at $1220/oz is if it can hold support at $1180-$1200/oz.

Feb262016YenGold

Yen/US$, Gold

Recent strength in the miners (GDXJ, GDX) has suggested Gold will hold above its key support at $1180-$1200/oz. However, there has been distribution in three of the past four trading days. If the miners can hold above support at point 1, (see the chart below) it would reinforce a bullish short-term outlook. In the case of a very strong US$ breakout and Gold losing $1200/oz then the miners could end up falling to point 2.

Feb262016miners

GDXJ, GDX Daily Candles

The rebound in the US$ index coupled with the failure of Gold and gold miners at resistance over the past three days puts us on guard for the start of a larger retracement in precious metals. The potential double top in the Yen/US$ pair as well as the mini breakdowns in Silver and Platinum are also cause for concern. It is certainly possible that precious metals can rally temporarily with a strong US$ and reach the upside targets mentioned last week. However, a strong breakout in the US$ index above 100 could very well precipitate the next correction in Gold and gold stocks if it has not already started. Consider learning more about our premium service including our favorite junior miners which we expect to outperform in 2016.

Jordan Roy-Byrne, CMT
Jordan@TheDailyGold.com

First published here: http://goldsilverworlds.com/gold-silver-experts/us-dollar-rebound-increases-near-term-risk/

Gold Rose Another 10% In February – Best Month Since January 2012

Gold Rose Another 10% In February – Best Month Since January 2012

Gold bullion rose 10.1% in February adding to the 7% gains seen in January. This means that gold is the best performing asset this year, up 17% so far in 2016. Silver is the next best performing asset with an 8% gain year to date, followed by US Treasuries (30 Year Bond) which have gained 7.8% so far in 2016.

Comparatively, the S&P 500 index is down 4.7% this year, the Dow Jones Industrial Average is down 4.5% and the NASDAQ is down 7.8%. International indices have also seen losses with the FTSE down 2.6%, the DAX down 10.7% and the Nikkei down 13.7% (see table below).

performance_february
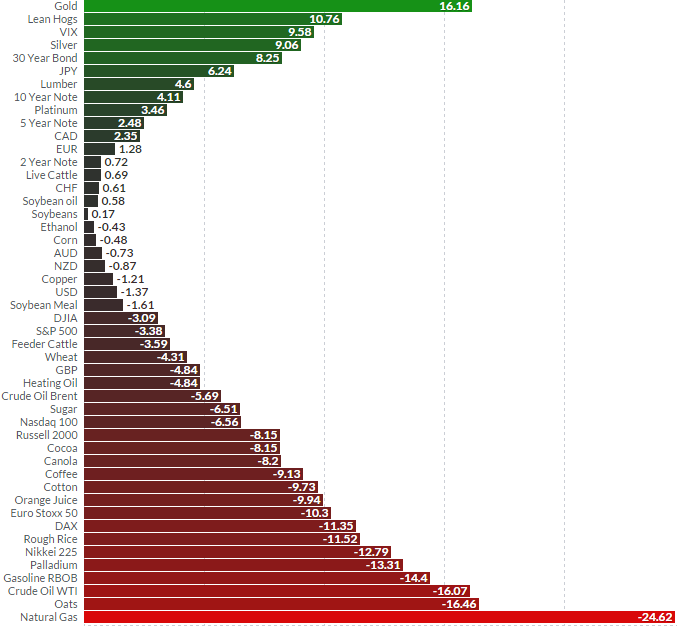
Market Performance in February – Finviz.com

Gold is again acting as a hedge for investors and pension owners exactly when they need a hedge.

The biggest influence going forward for gold is “likely to be risk appetite and concerns about markets and the global economy,” Mark O’Byrne, research director at GoldCore told Marketwatch.

“If stock markets begin to recover and make gains and risk appetite returns, then gold could come under selling pressure,” he said. “However, we believe the volatility seen in the first two months is likely to continue.”

Read more on Marketwatch here


7RealRisksBanner

‘7 Real Risks To Your Gold Ownership’ – Must Read New Gold Ownership Guide Here


LBMA Gold Prices
01 Mar: USD 1,240.00, EUR 1,141.70 and GBP 886.09 per ounce
29 Feb: USD 1,234.15, EUR 1,131.46 and GBP 890.95 per ounce
26 Feb: USD 1,231.00, EUR 1117.58 and GBP 878.87 per ounce
25 Feb: USD 1,235.40, EUR 1,121.41 and GBP 887.10 per ounce
24 Feb: USD 1,232.25, EUR 1,122.33 and GBP 885.52 per ounce


Gold and Silver News and Commentary

– Gold scores for biggest monthly gain in four years – Marketwatch
– Gold extends gains on safe-haven bids, fund inflows – Reuters
– Gold prices gain strongly in Asia after weak China PMI reading – Investing
– Gold Assets in World’s Top ETP Reach Highest Since September – Bloomerg
– Barclays shares drop 6% after £1.9bn loss and divi cut – FT

– Eurozone Slides Back Into Deflation – Telegraph
– Socialism has created a humanitarian disaster in Venezuela – City AM
– Gold Glows As Stocks Suffer Longest Losing Streak Since 2011 – Zero Hedge
– Patiently Climbing Aboard New Gold Bull – AU Report
– Wall Street Gold Buying Binge Continues – GLD back to 25M ozs – GoldSeek

Read more here


by Mark O’Byrne

www.Goldcore.com  

First published here: http://www.zerohedge.com/news/2016-03-01/gold-rose-another-10-february-%E2%80%93-best-month-january-2012

Future Gold Prices

The internet is filled with predictions for the price of gold, from $500 to $50,000 per ounce. It depends on your world view.

If you are a central banker or a powerful financial player which often supplies loyal employees to serve as Secretary of the U.S. Treasury, the low gold numbers look good.

Or, if you understand the incredible $200+ Trillion of debt the world has accumulated and realize it can’t be repaid, then gold at $10,000 probably looks inevitable. Crashes occur and sovereign debt markets look like paper bubbles with disastrous potential to send gold much higher.

A better approach to estimating future gold prices, in my opinion, is to start with a world view and project relevant gold prices. I suggest three simple scenarios, as I stated in my article, “Silver Prices in Five Years?

Scenario One – status quo: The next five years could look much like the last 20 – 40 years. Politicians spend too much money, debt expands exponentially, central banks monetize debt and desperately inflate and reflate bubbles to maintain their power and continue the transfer of wealth from the many to the few. This is “status quo” or “more of the same” and indicates that gold prices will rise substantially, but not in a hyperinflation.

Scenario Two – deflationary crash: Deflationary forces overwhelm the financial system and central bankers and politicians can’t or won’t reverse those deflationary forces. In that scenario most paper assets crash while the purchasing power of gold increases far more. Central bankers will do almost anything to avoid this scenario.

Scenario Three – deflation and hyperinflation: Deflationary forces temporarily crash the financial system (signs are visible in 2016-Q1), and eventually central bankers and governments inflate currencies, possibly to hyperinflationary levels in their heavy-handed reaction. In this scenario gold prices will go into the stratosphere – perhaps $5,000 or $50,000+ per ounce. The ultimate gold price in a hyperinflationary scenario is unpredictable since hyperinflationary forces feed upon themselves and destroy purchasing power unpredictably. Gold reached nearly 100 trillion Weimar Marks per ounce in 1923. Gold, if currently priced in 1945 (pre-devaluation) Argentina pesos would be over 10,000 trillion 1945 pesos. Hyperinflation is an ugly, destructive, and unpredictable process, even for a reserve currency.

In Scenario One – more of the same – we can reasonably expect:

Politicians and central bankers will manage the crisis of 2016-2017 as they have most other crises (such as 1987, 1998, 2000, 2008) by increasing spending, addressing an excess debt problem with even more debt, and pumping more “funny money” into the global financial system.

  1. Official US national debt increases more rapidly than its typical 9% per year compounded rate. (perhaps 10 – 12% per year)
  2. Dollars, euros, yen and other currencies devalue against each other and against real assets. (currency wars)
  3. Stock markets collapse further, and then, buoyed by central bank “printing” and currency devaluations, will rise.
  4. Depressed commodity prices will move much higher as currency devaluations are aggressively pursued by central banks.
  5. People and investors eventually realize that currencies are devaluing and they must avoid over-valued bonds, negative interest rates, crashing stock markets, and paper promises to preserve their savings. Gold prices will rally much higher based on increased investor demand in a supply constrained market.

Given the above “status quo” scenario, the VALUATON model I described in my book, “Gold Value and Gold Prices From 1971 – 2021” is relevant. The model is based on three variables, the official US national debt, the price of crude oil, and the S&P 500 Index. I used prices smoothed with moving averages since 1971 to define the basic trend of gold prices. The correlation of the calculated gold (using smoothed prices) with the actual smoothed annual prices was about 0.98 since 1971.

G92-Gold and Calc Gold-Version2

This valuation model works well within a broad range of economic conditions, including stock and bond bull markets, bear markets, crude oil bubbles and crashes, various forms of Quantitative Easing, Democratic and Republican Presidents, wars, and occasional peace.

Using “status quo” assumptions for future increases in official national debt and crude oil, and a collapsing S&P 500 Index, I created the following graph of “calculated gold” for the next several years.

G95-Gold High Future

This is a model based on reasonable assumptions but there is no guarantee those assumptions will be fulfilled. Strange and unexpected events have unfolded in the past decade. Examples:

  • In 2007 few expected the S&P 500 to fall below 700.
  • Who expected seven years of essentially zero interest rates in the US after the 2008 crisis?
  • Three years ago who would have predicted that in excess of $7 Trillion in sovereign debt in 2016 would yield “negative interest?”
  • Who in 2013 would have predicted sub-$30 crude oil?

My Point is:

  1. Strange and unpredictable events occur in a central banker controlled world dominated by overwhelming debt.
  2. Secondary and tertiary consequences of stupidity, wars, QE, ZIRP, and negative interest rates are difficult to predict.
  3. A deflationary collapse and hyperinflation are perhaps as likely as the four strange and unexpected examples above.
  4. Gold prices in a deflationary collapse or hyperinflationary blow-off are difficult to imagine.
  5. The more likely expectation, in my opinion, is a continuation of the “status quo” financial conditions we have experienced since 1971.

The model suggests that a reasonable “status quo” valuation for gold in 2021 is around $3,000. Prices will fall below and occasionally spike much higher than the valuation so a gold price of $5,000 in 2020 – 2022 is plausible. This is not a prediction! It is based on the observation that central banks devalue their currencies, governments spend to excess, and those actions affect the prices for crude oil, stocks, commodities, and gold. The model suggests that central bank devaluations and government actions could push gold prices to $3,000 to $5,000 in roughly five years, as central bank devaluations and government actions have pushed gold prices from about $40 in 1971 to about $1,200 in 2016.

CONCLUSIONS:

  • How crazy will it get? The future price of gold is very much dependent upon the reactions of governments and central banks regarding the current deflationary forces.
  • Status quo response: $3,000 – $5,000 per ounce is quite possible at some time in 2020 – 2022, if not sooner.
  • Deflationary crash response: Gold will substantially increase in purchasing power, but its price in dollars, euros, yen, etc. is difficult to estimate, depending upon the economic damage that occurs.
  • Hyperinflationary response: The price of gold will be unbelievably high.

I encourage you to purchase my book, “Gold Value and Gold Prices From 1971 – 2021.” It describes my empirical gold model. That book is available for $11.00 in paperback at www.gechristenson.com and Amazon. E-books are also available.

Protect your assets. Purchase physical gold and silver from Tom Cloud or Roxanne Lewis.

Gary Christenson
The Deviant Investor

First published here: http://goldsilverworlds.com/gold-silver-experts/future-gold-prices/

Buffet’s Math Trumped by Gold

Buffet’s Math Trumped by Gold 

By: Roy Sebag


Introduction

Every year, I patiently await the release of Warren Buffet’s Annual Letter written to shareholders of Berkshire Hathaway. Though I have “evolved” when it comes to macroeconomics and my understanding of monetary history, I still consider myself first and foremost a bottom-up deep value investor and view this methodology as the only logical method to analyze, invest, or short securities traded by market participants in a free market. As far as value investors go, Buffet and his mentor Benjamin Graham are not only the best practitioners of the craft but have basically re-invented it and evangelized it. For that, every investor should have and maintain great respect for Warren Buffet, Benjamin Graham and others including Charlie Munger, Irving Khan, Walter Schloss, and David Gottesman.

Value investing is what led Buffett to become the greatest investor of all time. He has, through his initial understanding of value investing, accumulated a collection of nearly 300 businesses spanning the globe. He has also amassed a significant fortune and more importantly, power. The same goes for Charlie Munger. With that power also comes an undoubted level of hubris, patriotism, and dare I say, statism.

Anyone that has followed the two as closely as I have can point to the specific moment when both realized their position of power was far more important to their interests than their ability to deduce market and political behaviour based on logic. It was 2008 when the financial crisis hit. That was when I believe Buffett and Munger realized they had become so successful and so big while the rest of the financial sector was so indebted and insolvent that, unless they started cheerleading, everything they had built would also be lost. It was ultimately fear which led Buffet to support Hank Paulson and even the big banks in stark contrast to his public positions in the prior decade.

I wrote about this in depth in an essay from 2012 which is entitled: “Respectfully Disagreeing with Buffett’s Recent Views on Gold”. I found it difficult to reconcile Buffett’s unsolicited comments about gold with the empirical historical data relating to his investment in silver, his public comments about inflation, and his father’s deep comprehension and support of the gold-standard as a congressman.  Later this year, I will also dismantle Buffet’s comment to Becky Quick on CNBC by demonstrating that gold has actually outperformed the Dow. That piece will show that there has not been any investment vehicle that would have enabled an investor to mirror the performance of the Dow index.

In short, reaching this stage has required a deep understanding of value investing, Berkshire Hathaway’s history, and gold to disprove these arguments, and I am grateful to possess this multidisciplinary approach.

Buffett’s Latest Rhetoric

In Buffett’s 2015 Annual Letter, sandwiched between a logical review of the company’s achievements, is Buffett’s latest attempt to cheerlead and obfuscate. Unfortunately for Buffett, I had nothing to do this weekend and decided to put together a point by point rebuttal to his latest rhetoric and sophistry.

On page 7 of the annual letter, Buffet writes the following:

It’s an election year, and candidates can’t stop speaking about our country’s problems (which, of course, only they can solve). As a result of this negative drumbeat, many Americans now believe that their children will not live as well as they themselves do.

That view is dead wrong: The babies being born in America today are the luckiest crop in history. American GDP per capita is now about $56,000. As I mentioned last year that – in real terms – is a staggering six times the amount in 1930, the year I was born, a leap far beyond the wildest dreams of my parents or their contemporaries. U.S. citizens are not intrinsically more intelligent today, nor do they work harder than did Americans in 1930. Rather, they work far more efficiently and thereby produce far more. This all-powerful trend is certain to continue: America’s economic magic remains alive and well. [emphasis added]

Here Buffett is obviously taking a jab at politicians and other market participants that state the obvious: The US and other western economies are slowing, labor participation rates are at an all-time low, fertility rates are declining, household formation rates are declining, inflation is rising in the things we need, deflation is creeping in the things we own and most importantly, the gap in wealth inequality keeps growing to unprecedented levels.

These statements are not hypotheses; they are empirical and point toward a deviation from the historical path which made western democracies such as the US the most impressive prosperity machines in history. Buffett is once again fearful as he was in 2008 because he knows very well that the solution to recalibrating the path is the aggressive revaluation of the ratio of global assets to global debt.

Buffet’s creative solution is to leverage his deep understanding of real-inflation which forms the crux of his insurance float business model to obfuscate US data and convince readers that Americans are better off today than they were in 1930 (the year Buffett was born). He elects US GDP per Capita as the metric to convey this view and authoritatively declares that everyone else is “dead wrong”.

“Real” GDP per Capita – Many ways to Skin the Cat

Buffett arrives at a $56,000 2016 “Real” GDP per Capita for the US. He does so by saying “about $56,000”. Now, I could not reconcile this figure, the closest I came was via the St. Louis Fed’s “Real Gross Domestic Product per Capita” figure published here  which comes in at $50,993 for Q4 2015.  Nevertheless, let us take Buffett’s $56,000 figure at face value.

The Real GDP per Capita is calculated by taking the nominal GDP in US Dollars (which we have a history of dating back to 1790) and dividing that figure each year by the population figures. The result is a nominal GDP per capita figure one can trace back to 1790. A good website for perusing this type of data is: www.measuringworth.com. Here is where the monkey magic begins. Economists and now Buffet take this nominal data which is empirical and deflate it with some type of a formula to arrive at what they consider the “real” GDP per Capita figure. This, they claim provides an accurate measurement of historical GDP per Capita figures in today’s unit of account and helps to measure productivity over time.

Of course, any intelligent market participant knows the formula used by most economists (the consumer price index) is severely flawed and doesn’t reconcile with reality. Recently, I published a short piece on ZeroHedge showing how the Economist magazine uses the CPI and other useless formulas to manipulate gold’s true performance.

GDP per Capita Priced in Gold

When it comes to financial analysis, I try and focus on what I consider to be “universal truths”: wisdom or knowledge that is as close to foundational as possible. Mathematics for example, is universally true. Gravitational forces in the universe are also universally true. Buffett’s analysis and conclusion lacks rigor as it relies on a subjective variable (deflating a historical nominal GDP by a CPI index to measure productivity and quality of life) and then disregards the most important one: That 20.67 US Dollars in 1930 was equivalent to 1 Troy Ounce of .9999 or better elemental Gold (Au).

Buffett makes the argument that his $56,000 today is six times better (even after his adjustment for inflation) than the $858 of GDP per Capita each US Citizen earned in 1929 but forgets to mention that $858 in 1929 was equivalent to 41.5 Troy Ounces of Gold in 1929. Here is the math:


The result is unequivocal: When measuring on an apple to apples comparison, there has been little to no gain in GDP per capita over the last 86 years in the United States. There is most certainly not a six times increase in productivity nor is there an increase in the quality of life per capita as measured using the same unit of account that was used in 1929. Buffet’s manipulating of the figures without reconciling under the apple to apples gold method is trumped by math.

I have built a graph of US GDP per Capita priced in Gold from 1929 to 2015. On first glance, this graph appears to show that there were in fact times where, as measured on an apple to apples basis, the US was gaining in both productivity and quality of life on a per capita basis.

Gold GDP per capita

A part of me agrees with the graph and ascribes the first cycle from 1942 to 1971 as a classic post-war expansion fueled by healthy demographics, sound economic policies, normalized interest rates and the discovery and proliferation of conventional oil as a primary energy source. The second period from 1987 to 2001, in my view reflects the Greenspan era of targeting the gold price with the fed funds rate as he explains in his book “Age of Turbulence”. Though there were many unintended consequences brewing, market observers should agree that interest rates from the early 1980’s to 2001 incentivized savings and productive usage of capital.

Today, we have neither. We don’t have a market rate that incentivizes savings, nor do we have healthy demographics or sound economic policies. Most millennials prefer to remain single and defer household formation. When they do form households, their fertility rates are far lower than their parents.

GDP per Capita Priced in Gold Excluding Government Spending

There is an even more distressing analysis of the GDP per capita figures. In searching through the data, I noticed that government spending as a percentage of nominal GDP has been creeping up from 1930’s through today. If one is to extrapolate productivity or quality of life from GDP per capita as Buffet has done, shouldn’t the government component be excluded? Even the most ardent Keynesian would agree that government spending is not the arbiter of the free market but there to smoothen out the business cycle.

In 1929, government spending as a percentage of GDP was 11.16%. In 2015, it was 36%. Unsurprisingly, the adjustment of nominal GDP each year to exclude government and the subsequent adjustment of the resultant figure to Gold from 1929 to 2015 shows a completely different picture:

Gold ex gov spending GDP per capita

Though this graph resembles the prior graph, it’s important to observe carefully. The Gold adjusted Ex Gov Spending GDP per Capita figure shows less pronounced cycles than before. This is crucial as it indicates a longer-term asymptotic decline in peaks achieved by the US economy when excluding government spending. For market participants familiar with technical analysis, this resembles a “lower high” chart pattern. More importantly, the 2015 Gold adjusted Ex Gov Spending GDP per Capita figure is $35,690 down 17.3% over 86 years vs. $43,157 which was the same figure for 1929.

Conclusion

We cannot prosper as a society unless we are using the right measurement tools. In this piece I showed how Warren Buffet was able to fool most people into believing they are six times better off today than their ancestors. It’s easy to convince anyone of anything if the author is both brilliant, powerful, and has an artifice through which they can distort the past. By using a measurement tool that is totally arbitrary such as the CPI to deflate nominal GDP per Capita, Buffett attempts to show empirical and logical analysis.

In reality, he diverted the public’s attention from a critical factor: that the historical dollars were redeemable in gold.

If you understand basic science and elementary physics, you will quickly grasp why only gold should be used as a measuring system for our productivity and prosperity. Most people who own gold don’t fully understand why they do. In my encounters with leading gold investors and market participants, the smartest own it because they understand it to be antithetical to everything else in financial markets. Another popular axiom is: It’s an “asset” without counterparty risk or an “insurance policy”. These are reasons for owning gold that miss the critical reason for why gold ascended as money in the first place. For those interested, I recommend these two pieces. The answer has little to do with economics and lots to do with physics:

Why Gold – BitGold.com by Roy Sebag and Josh Crumb

Gold Price Framework Vol. 1: Price Model by Stefan Wieler and Josh Crumb

At GoldMoney Inc. (TSX: XAU.V), we continue to build the world’s first full-reserve and gold-based financial services company offering savings, payments, wealth services, custody, execution, and research for nearly 750,000 clients in 200 countries. By doing so, we empower people around the world to measure their prosperity with something remarkable and timeless.


First published here: http://www.zerohedge.com/news/2016-02-29/buffet%E2%80%99s-math-trumped-gold

Gold-Silver Ratio Breakout Report, 28 Feb, 2016

The gold to silver ratio moved up very sharply this week, +4.2%. How did this happen? It was not because of a move in the price of gold, which barely budged this week. It was due entirely to silver being repriced 66 cents lower.

This ratio is now 83.2. It takes 83.2 ounces of silver to buy an ounce of gold. Conversely, it takes 1/83.2oz (about 0.37 grams) of gold to buy an ounce of silver.

This ratio is now within a hair’s breadth of breaking out past the high set on Oct 17, 2008. See the historical graph (based on LBMA silver fix and PM gold fix data, provided by Quandl).

The Historical Ratio of the Gold Price to the Silver Price
Historical ratio

Monetary Metals has been predicting a ratio well over 80 for a long time. And for two months, we have been calling for it to go much higher still. Could there be a correction? Absolutely. Could the fundamentals change? We expect they will—at some point. We will call that when we see it.

Speaking of the fundamentals, read on for the only true picture of the gold and silver supply and demand fundamentals…

But first, here’s the graph of the metals’ prices.

        The Prices of Gold and Silver
prices

We are interested in the changing equilibrium created when some market participants are accumulating hoards and others are dishoarding. Of course, what makes it exciting is that speculators can (temporarily) exaggerate or fight against the trend. The speculators are often acting on rumors, technical analysis, or partial data about flows into or out of one corner of the market. That kind of information can’t tell them whether the globe, on net, is hoarding or dishoarding.

One could point out that gold does not, on net, go into or out of anything. Yes, that is true. But it can come out of hoards and into carry trades. That is what we study. The gold basis tells us about this dynamic.

Conventional techniques for analyzing supply and demand are inapplicable to gold and silver, because the monetary metals have such high inventories. In normal commodities,
inventories divided by annual production (stocks to flows) can be measured in months. The world just does not keep much inventory in wheat or oil.

With gold and silver, stocks to flows is measured in decades. Every ounce of those massive stockpiles is potential supply. Everyone on the planet is potential demand. At the right price, and under the right conditions. Looking at incremental changes in mine output or electronic manufacturing is not helpful to predict the future prices of the metals. For an introduction and guide to our concepts and theory, click here.

Next, this is a graph of the gold price measured in silver, otherwise known as the gold to silver ratio. The ratio was up substantially. 

The Ratio of the Gold Price to the Silver Price
ratio

For each metal, we will look at a graph of the basis and cobasis overlaid with the price of the dollar in terms of the respective metal. It will make it easier to provide
brief commentary. The dollar will be represented in green, the basis in blue and cobasis in red.

Here is the gold graph.

        The Gold Basis and Cobasis and the Dollar Price
gold

The price was basically unchanged. The cobasis (i.e. scarcity) was also just about unchanged. This, by the way, was also true for farther-out contracts although we only show April in this free Report.

We calculate a fundamental gold price of over $1,440. This is the price we would have if the price effect of speculation was subtracted out of the market. Who would be shorting gold at this point? We have an idea of one group that may appear sacrilegious to the gold community.

Let’s get it out of the way. No, it’s not the Powers That Be, the commercial banks, the central banks, or the Illuminati. It’s the silver bugs. Consider the widespread belief—at least outside of readers of this Report—in silver outperformance. Who doesn’t think the ratio should be far lower—50 for starters, on the way to 16 as in Ye Times of Olde?

How would you trade this thesis? You would short gold futures and go long silver futures in equal dollar amounts. This would of course push up the price of silver, and push down the price of gold

We would say to anyone in this trade to be careful, but obviously they don’t read this Report. If you must trade this trend, you should do the opposite: long gold, short silver (and be wary of violent corrections).

How do we explain that the price of gold is 15% below its fundamental, while the price of silver is only at a 2% premium? The silver market is less liquid than the gold market, so equal dollar values of this trade would push the silver price up more than it would push the gold price down.

We have two thoughts on this. One, if most traders think of the metals as commodities—we saw yet another article on this theme today—and if commodities are in a bear market, then the metals are hated. Perhaps silver would be 30% under its fundamental—i.e. about $10—if it weren’t for this trade that alters the relationship of silver to gold.

Maybe. Our other thought is that if this is a new bull market in gold—i.e. a bear market in the dollar—it’s in stealth mode at the moment. Mainstream traders are not excited about gold speculation. They’re not buying gold futures, and may even be short. We are aware of the Commitment of Traders report (COT), showing that non-commercials (i.e. speculators) have a net long position. It’s the commercials (i.e. miners and jewelers) who have the short position. Perhaps it’s the miners putting on more hedges—i.e. selling more of their production forward. Maybe it’s the reduced forward buying of the gold users.

Whatever the factors, one thing’s for sure. The price of gold in the futures market is sagging relative to the price of gold in the spot market.

Our approach is not based on aggregate quantities. That’s why we don’t stop at the COT data. We look at spreads. Spreads inform us in a way that strict quantity analysis cannot. If you doubt this, ask how many COT analysts predicted the price action in silver or the ratio.

This graph shows the rates we observe to carry gold for contracts in 2016 (i.e. basis).

        The Gold Bases for 2016 and LIBOR
gold bases and LIBOR

These yields are hardly worth anyone’s while to buy gold and sell a future against it, not to mention that the cost of funding this trade is about twice the return on the trade. Carrying gold does not pay, because gold is not abundant enough in the market to be available to carry.

Now let’s look at silver.

The Silver Basis and Cobasis and the Dollar Price
silver

In May silver, we see the scarcity (i.e. cobasis) drops on Tuesday when the price of the dollar falls (i.e. the price of silver rises), and a rising scarcity as silver is becoming cheaper. It’s no surprise that the big rise in scarcity occurred on Friday, with the big drop in price. No question, futures sold off.

Another glance confirms it. Look at the epic drop in the basis. It’s down almost to match the gold basis (though the cobasis is nowhere near what is in gold). To review, here are our definitions:

Basis = Future(bid) – Spot(ask)

Cobasis = Spot(bid) – Future(ask)

The basis is down because the bid on the May contract is being pressed down. Silver—at this price—is no longer so abundant. The basis is well below LIBOR. However, it’s not particularly scarce. The ask on the May contract is still strong, still being lifted by buying pressure.

Last week, we showed a picture of “icicles” dripping on the chart of spot silver.

silver icicles

This is in contrast to the futures chart. First, thanks to several folks who wrote to say that these are usually called “shadows”. We used the term icicle because of its connotation of dripping down. We believe that the cause is that metal is being sold, pushing the price down. But then that creates an actionable arbitrage to carry silver. So the market makers buy spot and sell the future. This does two things. One, obviously, it records a trade in the spot market at ask price and lifts the ask. Two, it presses the bid price in the futures market.

If this is correct, then silver is intermittently abundant. At times when there’s selling of metal in the spot market, it’s abundant enough to go into the warehouse. At other times, and we’ll see more of this if the price falls further, it’s not so abundant.

The fundamental price of silver fell about a nickel this week. The market price is much closer to the fundamental now.

This brings us to the ratio. The fundamental on the ratio hit over 100 this week.

What does it mean that the market ratio is just about to break out past its 2008 high, while the fundamental is predicting we could hit the record set in 1991? Ironically, the gold-silver ratio is showing something that most mainstream signals cannot.

The seasonally adjusted unemployment number looks brilliant at under 5%. The S&P 500 index of stocks is only about 10% off its highs from the first half of last year. Sure, there’s that epic collapse in the price of crude oil and other commodities, but pay no heed. Cheap oil means cheap gas which gives money back to consumer who can spend spend spend our way to prosperity.

The gold to silver ratio is showing us that the junior money is getting cheaper relative to the senior money. It is showing us that the metal which has industrial demand as well as monetary is falling relative to the metal whose demand is entirely monetary. It is also showing us that tightening credit conditions are starting to matter. So far as silver is concerned, credit conditions today match those which existed in October 2008.


© 2016 Monetary Metals

First published here: http://www.zerohedge.com/news/2016-02-28/gold-silver-ratio-breakout-report-28-feb-2016

Why Is The Dutch Central Bank Suddenly Moving Its Gold? And Why Is ABN Amro Becoming Bullish?

Russia Gold

An interesting fact has hit the newswires earlier this week, as the Dutch Central Bank confirmed it was looking to (temporarily?) move its gold reserves to another secure location. The DNB claims it has to renovate its vaults and thus needs to store the yellow metal elsewhere and that’s quite surprising as the central bank repatriated a large part of its gold reserves less than 18 months ago.

If this renovation has been scheduled a long time ago, why were the Netherlands so anxious to bring its gold back home? And why is the central bank using ‘renovations’ as the official reason even though some officials have indicated the DNB might be looking to permanently store the gold elsewhere?

Of course, as it’s a government institution, ‘poor planning’ always is a very valid excuse and even though it would make more sense to first think where the DNB would store the gold, politicians and commissioners appointed by the political system aren’t really known to make the best decisions. But there’s another possibility here. Officially, the Dutch central bank is no longer leasing its gold to commercial counterparties, but the possibility the central bank has been forced into a corner by the other central banks is not impossible.

Gold DNB

Source: Vossen.info

The demand for physical gold is booming, and it’s a very big coincidence the Dutch Central Bank is considering to move its gold again during these volatile times. After all, we can’t imagine the bank will find a suitable place to store almost 200 tonnes of gold within the next few quarters or years so if the renovation of the bank is really necessary, where do you think the DNB will have to store its gold again? Yes, indeed, in the vaults of another foreign central bank.

This could indicate two things. First of all, it’s possible the DNB has been asked to do certain other market participants a favor by delivering physical gold upon their request as some parties on the futures-market might be unable to effectively deliver the gold their futures are representing. There obviously is no hard evidence to support this theory but even by looking at just the retail sales of the US Mint, the gold sales have more than doubled compared to last year. In the first 7 weeks of this year, the total amount of American Eagles minted and sold consisted of almost 200,000 ounces gold whereas the total demand for gold in January and February (full month) was less than 100,000 ounces in 2015 and just 120,000 ounces in 2014. So the demand for bullion is definitely there, both from retail and from central banks.

China still remains the largest net purchaser of gold as the country acquired 128 tonnes of the precious metal (4.1 million ounces) in just December and January so the total amount of physical gold available for other market parties is very low. In fact, we estimate China took delivery of a total amount of gold in 2015 equivalent to 40% of the annual world production and that should tell you a lot, as India also imported a total of 1,000 tonnes of the yellow metal. So, the total demand for physical gold from India and China combined is the equivalent of in excess of 70% of the total gold production in the world, and that’s massive.

Gold COMEX Registered

Source: 24hgold.com

Throw in the fact the total amount of registered gold at the COMEX (the gold that is available for physical delivery) has reached multi-year lows (see the previous image), and the decision of the Dutch Central Bank to think about ‘relocating’ the gold again is very intriguing.

On top of that, ABN Amro, which has been extremely bearish on the gold price, predicting we would see $800-900 soon has now completely changed its mind and is now predicting to see $1300  before the end of this year.

An acute outbreak of gold fever? Time will tell!

>>> Protect Your Wealth: Download our New Gold Report

Secular Investor offers a fresh look at investing. We analyze long lasting cycles, coupled with a collection of strategic investments and concrete tips for different types of assets. The methods and strategies are transformed into the Gold & Silver Report and the Commodity Report.

Follow us on Facebook @SecularInvestor [NEW] and Twitter @SecularInvest

First published here: http://www.zerohedge.com/news/2016-02-28/why-dutch-central-bank-suddenly-moving-its-gold-and-why-abn-amro-becoming-bullish

Silver Prices: This Will Continue to Lift Silver Prices Higher

Gold and silver prices are being driven higher by global economic weakness and the growing number of central banks implementing negative interest rates. While gold and silver prices normally have a negative relationship to a strong U.S. dollar and low interest rates, that’s not the case this time around. And until the global economy registers sustainable growth, gold and silver will continue to be one of the most attractive investments out there.
Gold & Silver Rise on Growing Fears of a Global Recession
After years of unsustainable double-digit growth, the stock.

The post Silver Prices: This Will Continue to Lift Silver Prices Higher appeared first on Profit Confidential.

First published here: http://www.profitconfidential.com/silver/silver-prices-this-will-continue-to-lift-silver-prices-higher/

Silver-screen playbook

IN 1983 William Goldman, a screenwriter, coined the famous saying that in Hollywood, “Nobody knows anything” when it comes to predicting which films will succeed at the box office. To find out how true that remains, we have analysed the performance of more than 2,000 films with a budget of more than $10m, released in America and Canada since 1995, to see which factors help make a movie a hit.

Crunching information from The Numbers, a website that collects data on film releases, and Rotten Tomatoes, an aggregator of critics’ and punters’ reviews, we found that the strongest predictor of absolute box-office receipts is a film’s budget. Even if it got no boost from its cast, from favourable reviews or other factors, a movie would generate an average of 80 cents at American and Canadian cinemas for every dollar a studio promises to spend on it. A film’s budget is announced while it is in production, to create a buzz and signal its quality—though in practice its true cost may vary from the announced figure.

The more a studio commits to producing a film, the more it is likely to spend on advertising it. The budget also helps…Continue reading

First published here: http://www.economist.com/news/business/21693594-how-make-hit-film-silver-screen-playbook?fsrc=rss

“Buy Gold” As “Insurance Is Warranted” – Deutsche Bank

“Buy Gold” As “Insurance Is Warranted” – Deutsche Bank

Buy gold as “insurance is warranted”, Deutsche Bank have advised in a note issued today.

The embattled German bank has said that rising economic risks and market turmoil mean investors should buy gold for insurance.

performance_YTD_2016

Market Performance – 2016 YTD via Finviz.com 

“There are rising stresses in the global financial system; in particular the rising risk of a U.S. corporate default cycle and the risk of a sharp one-off renminbi devaluation due to the sharp increase in China’s capital outflows,” Deutsche Bank added.” Buying some gold as ‘insurance’ is warranted,” as reported by CNBC.


LBMA Gold Prices
26 Feb: USD 1,231.00, EUR 1117.58 and GBP 878.87 per ounce
25 Feb: USD 1,235.40, EUR 1,121.41 and GBP 887.10 per ounce
24 Feb: USD 1,232.25, EUR 1,122.33 and GBP 885.52 per ounce
23 Feb: USD 1,218.75, EUR 1,106.62 and GBP 863.43 per ounce 
22 Feb: USD 1,203.65, EUR 1,088.17 and GBP 849.21 per ounce

After initial falls again on Sunday night, Monday morning, gold has eked out slight gains this week in dollar and euro terms and has seen more strong gains in sterling terms as sterling continues to weaken on BREXIT and UK economy concerns.

Silver is lower in dollars and euros but has made small gains in sterling terms ($15.12/oz, €13.74, £10.80).

Gold and Silver News and Commentary
Gold moves revive memories of 1990s currency crisis – CNBC
Gold rises as bullish technicals, fund flows counter equity gains – Reuters
Asian Stocks Jump With Metals as Zhou Sees Easing Room – Bloomberg
Gold Tops Silver by Most Since 2008 as Investors Fret on Growth – Bloomberg
Jobless Claims in U.S. Rise in Holiday Week From Three-Month Low – Bloomberg

Gold Bulls Predict $US2,000-Plus Prices – ABC
Gold the ‘Superhero’ May Shoot Up to $1,400: Top Forecaster – Bloomberg
Aggressive Silver Capping Continues – Silver Seek
Deliverable Silver Stocks At The COMEX Reach Historic Low – Silver Seek
Why Some Think Australia’s Housing Market Is Due for a 2008 Moment – Bloomberg

Click here

www.goldcore.com

First published here: http://www.zerohedge.com/news/2016-02-26/%E2%80%9Cbuy-gold%E2%80%9D-%E2%80%9Cinsurance-warranted%E2%80%9D-%E2%80%93-deutsche-bank

Silver Prices: Last Time This Happened, Silver Prices Soared 800%

Here’s Why Silver Prices Could Soar 800%
This is a message to silver investors: there’s something interesting happening with silver prices and it shouldn’t be ignored. It suggests the precious metal could soar well over 800%.

Before jumping to any conclusion, please look at the chart below and pay close attention to the blue line and the circled areas..

The post Silver Prices: Last Time This Happened, Silver Prices Soared 800% appeared first on Profit Confidential.

First published here: http://www.profitconfidential.com/silver/silver-prices-last-time-this-happened-silver-prices-soared-800-percent/